 AR
AR Downloads
 Glossary
 Search


Westcon International performance
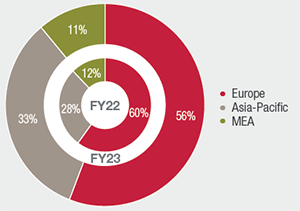
Westcon International revenue percentage contribution by geography
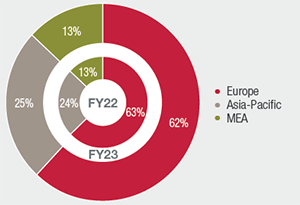
Westcon International gross profit percentage contribution by geography
| US$ million | FY23 | FY22 | % movement |
|
| Revenue | 3 420.6 | 2 890.4 | 18 | |
|---|---|---|---|---|
| Gross profit | 328.7 | 319.0 | 3 | |
| Gross margin (%) | 9.6 | 11.0 | ||
| Operating costs | (280.3) | (250.9) | 12 | |
| EBITDA | 48.4 | 68.1 | (29) | |
| EBITDA margin (%) | 1.4 | 2.4 | ||
| Adjusted EBITDA | 95.1 | 78.6 | 21 | |
| Adjusted EBITDA margin (%) | 2.8 | 2.7 | ||
| Operating profit | 21.7 | 43.6 | (50) | |
| Operating profit margin (%) | 0.6 | 1.5 |
Net working capital
Net working capital days increased to 23 days (FY22: 15 days) due to a combination of higher days sales outstanding and a reduction in inventory turns partially offset by an improvement in days payable outstanding, mainly as a result of extra payment days received from Cisco. Net debt decreased US$16.6 million to US$68.4 million (FY22: US$85.0 million).
Cash and net debt
| US$ million | FY23 | FY22 | |
| Cash resources | 332.3 | 204.5 | |
|---|---|---|---|
| Bank overdrafts | (7.1) | (7.5) | |
| Short-term interest-bearing liabilities and short-term leases | (361.9) | (243.5) | |
| Long-term interest-bearing liabilities and long-term leases | (31.7) | (38.5) | |
| Net debt | (68.4) | (85.0) |
Non-financial performance
Westcon International has successfully continued to roll-out and increase adoption of internal tools, new applications, and extended partner and vendor integrations that have all contributed to improved internal and external stakeholder experiences.
The business has, once again, been awarded numerous vendor awards and accolades in recognition of the outstanding execution in all markets in which the business operates (refer to the Westcon International divisional report).
Westcon International's ONE Westcon, related employee wellness initiatives and training programmes all continue to enrich the lives of every Westcon International member motivating them to make outstanding contributions.
Westcon International is committed to ambitious corporate climate action and has signed up to the SBTi initiative and formally committed to set net zero targets for validation by the SBTi.