 AR
AR Downloads
 Glossary
 Search


Logicalis Latin America performance
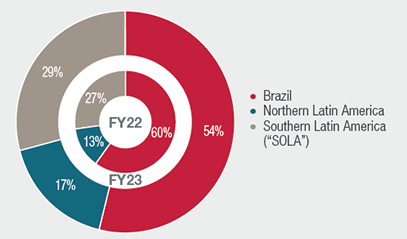
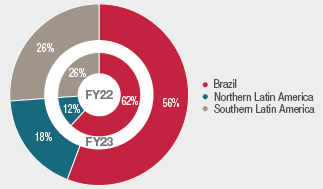
Logicalis Latin America revenue
percentage contribution by geography
Logicalis Latin America gross profit
percentage contribution by geography
| US$ million | FY23 | FY22 | % movement |
|
| Revenue | 491.0 | 522.7 | (6) | |
|---|---|---|---|---|
| Gross profit | 109.5 | 106.5 | 3 | |
| Gross margin (%) | 22.3 | 20.4 | ||
| Operating costs | (88.3) | (78.0) | 13 | |
| EBITDA | 21.2 | 28.5 | (26) | |
| EBITDA margin (%) | 4.3 | 5.5 | ||
| Adjusted EBITDA | 24.9 | 27.9 | (11) | |
| Adjusted EBITDA margin (%) | 5.1 | 5.3 | ||
| Operating profit | 13.8 | 21.0 | (34) | |
| Operating profit margin (%) | 2.8 | 4.0 |
Cash and net debt
The decrease in net debt compared to FY22 was driven primarily by decreased volume of business, reducing working capital requirements.
| US$ million | FY23 | FY22 | |
| Cash resources | 56.8 | 32.0 | |
|---|---|---|---|
| Bank overdrafts | (47.2) | (31.9) | |
| Short-term interest-bearing liabilities and short-term leases | (13.8) | (14.4) | |
| Long-term interest-bearing liabilities and long-term leases | (21.0) | (26.1) | |
| Net debt | (25.2) | (40.4) |
Non-financial performance
Logicalis Latin America achieved its FY23 strategic objectives. Cloud professional and managed services revenues increased with the introduction of new lifecycle solutions. It also expanded its continuous delivery services throughout Latin America. Notable improvements were made towards it responsible business agenda and Logicalis Brazil issued a Sustainability Report in 2022.